BayesGrad: Explaining Predictions of Graph Convolutional Networks
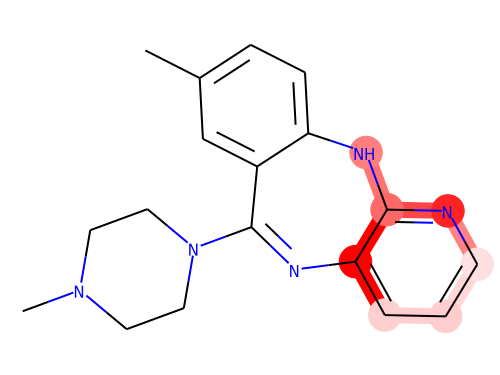
Recent advances in graph convolutional networks have significantly improved the performance of chemical predictions, raising a new research question: "how do we explain the predictions of graph convolutional networks?" A possible approach to answer this question is to visualize evidence substructures responsible for the predictions. For chemical property prediction tasks, the sample size of the training data is often small and/or a label imbalance problem occurs, where a few samples belong to a single class and the majority of samples belong to the other classes. This can lead to uncertainty related to the learned parameters of the machine learning model. To address this uncertainty, we propose BayesGrad, utilizing the Bayesian predictive distribution, to define the importance of each node in an input graph, which is computed efficiently using the dropout technique. We demonstrate that BayesGrad successfully visualizes the substructures responsible for the label prediction in the artificial experiment, even when the sample size is small. Furthermore, we use a real dataset to evaluate the effectiveness of the visualization. The basic idea of BayesGrad is not limited to graph-structured data and can be applied to other data types.
PDF Abstract
